
College football is a study of sensory overload. When players run out of the tunnel, they are met with an overwhelming array of noise; the band blaring the fight song, the PA announcer welcoming the team to the field, a screaming crowd ranging from rambunctious children to rowdy students to curmudgeonly alumni. In stadiums that are scientifically engineered to trap noise and multiply the effect, the power of noise serves two purposes: to pump up the home team, and to put the visitors on ice.
The 2016 Michigan football schedule is not exceedingly difficult, but Michigan’s two biggest games are on the road in East Lansing and Columbus, certainly giving the Michigan faithful pause when predicting the next season’s wins and losses. Fans always travel well, but nothing can beat the comfort of the four walls of your home stadium, especially when it’s a vibrant 110,000+ adorned in bright maize. Home field advantage, the curious beast it may be, is more prevalent in college than any other form of athletics. But what happens when the team is plucked from its throne and is asked to play the toughest opponent of the year in a foreign stadium?
Bowl season, that’s what happens. And anything can happen. With 42 bowl games this season, college football teams, representatives of all corners of the country from Washington to UCLA, from UConn to Miami, will pack up their lockers and their equipment and look to end the season emphatically. For Michigan, it’s to achieve that elusive 10th win, to prove that the “Harbaugh Effect” is ahead of schedule and, in fact, a real phenomenon. For a team like Nebraska, it’s to prove that a losing record isn’t a synonym for a bad team.
Whatever the motivation it may be, the biggest hurdle before the game is traveling. For many schools, it’s thousands of miles. For many of those same schools, it’s not a particularly daunting thousand miles; they have the funds to travel comfortably, safely, and punctually, allowing plenty of time to adjust to new time zones and field conditions.
Traveling for teams is one thing, but what about the fans?
I put myself in a student’s shoes and calculated every Power 5 team’s total mileage to their bowl game. The mileages are according to Google Maps, by car, from campus to stadium. I understand why bowl games are naturally in the south and western regions of the country, I don’t want to sit in 20 degree weather watching football as much as the next guy, this was purely driven out of curiosity. As I mentioned before, big programs will leave at least a week ahead of time to adjust to time zone, climate, and other various living conditions, so there may not be a correlation between distance traveled and outcome of the game, but let’s find out. I broke it down by conference.
Big Ten
| Bowl | Site | Team 1 | Mileage | Team 2 | Mileage | Difference | Winner |
| Pinstripe | Yankee Stadium | Indiana | 768 | Duke | 503 | 265 | Duke |
| Foster Farms | Levi’s Stadium | Nebraska | 1641 | UCLA | 341 | 1300 | Nebraska |
| Quick Lane | Ford Field | Minnesota | 693 | Central | 155 | 538 | Minnesota |
| Holiday | Qualcomm Stadium | Wisconsin | 2029 | USC | 121 | 1908 | Wisconsin |
| Cotton | AT&T Stadium | MSU | 1676 | Alabama | 604 | 1072 | Alabama |
| Outback | Raymond James Stadium | Northwestern | 1161 | Tennessee | 669 | 493 | Tennessee |
| Citrus | Citrus Bowl | Michigan | 1141 | Florida | 110 | 1031 | Michigan |
| Fiesta | U of Phoenix Stadium | Ohio State | 1921 | Notre Dame | 1830 | 91 | Ohio State |
| Rose | Rose Bowl | Iowa | 1789 | Stanford | 354 | 1435 | Stanford |
| TaxSlayer | EverBank Field | Penn State | 906 | Georgia | 339 | 567 | Georgia |
The Big Ten had to travel further than every single one of its opponents, which comes with the territory of being the conference in the north. As a conference, Big Ten teams traveled an average of 1,372 miles and a total of 13,720 miles while their opponents traveled a total of 5,026 miles. Wisconsin went the furthest with 2,029 miles, and won their game, Minnesota had the shortest trip with 693 miles. Of the 5 teams with the most mileage (Wisconsin, OSU, Iowa, MSU, Nebraska), 3 teams won their game. Of the 5 teams with the biggest difference (Wisconsin, Iowa, Nebraska, MSU, Michigan), 3 teams won their game. More quick points:
- Worst difference: 1,908 miles; Wisconsin (2,029) vs. USC (121)
- Most favorable difference: -91; OSU (1,921) vs. Notre Dame (1,830)
- B1G bowl game winners traveled a total of 7,425 miles and averaged 1,485 while their opponents traveled a total of 2,557 and averaged 511.4.
- B1G bowl game losers traveled a total of 6,300 miles and averaged 1,260 miles while their opponents traveled a total 2,469 and averaged 493.8.
SEC
| Texas | NRG Stadium | LSU | 279 | Texas Tech | 526 | 247 | LSU |
| Birmingham | Legion Field | Auburn | 114 | Memphis | 229 | 115 | Auburn |
| Belk | Bank of America Stadium | Miss. State | 531 | NC State | 165 | 366 | Miss St. |
| Music City | Nissan Stadium | Texas A&M | 763 | Louisville | 174 | 589 | Louisville |
| Cotton | AT&T Stadium | Alabama | 604 | MSU | 1676 | 1072 | Alabama |
| Outback | Raymond James Stadium | Tennessee | 669 | Northwestern | 1161 | 492 | Tennesee |
| Citrus | Citrus Bowl | Florida | 110 | Michigan | 1141 | 1031 | Michigan |
| Sugar | Superdome | Ole Miss | 348 | Oklahoma State | 715 | 367 | Ole Miss |
| TaxSlayer | EverBank Field | Georgia | 339 | Penn State | 906 | 567 | Georgia |
| Liberty | Liberty Bowl | Arkansas | 147 | Kansas State | 577 | 430 | Arkansas |
In the polar opposite travel pattern of the Big Ten, the SEC had the shortest total trip. Their 10 teams won 8 games and traveled 3,904 miles, averaging 390.4 per trip, compared to their opponents 7,997 miles total. Texas A&M’s 763 miles was the longest trip, and Florida had the SEC’s shortest, a whopping 110 mile trip to Orlando. Only two teams, Texas A&M (lost) and Mississippi State (won), had to go further than their opponent. Of the 5 biggest differences (4 of which they were favored in terms of distance), the SEC won 3. Of the 5 teams with the longest total trips, only Texas A&M lost.
- Worst difference: 589 miles; Texas A&M (763) vs. Louisville (174)
- Most favorable difference: 1072 miles; Alabama (604) vs. MSU (1676)
- SEC’s 8 bowl game winners traveled 3031 miles averaging 379 per trip; their opponents traveled 4453 miles and averaged 556 miles.
- SEC’s 2 bowl game losers traveled 873 miles total, averaging 436.5 miles per trip; their opponents traveled 1,315 miles, averaging 657.5 per trip. Coincidentally, the two losers had both the shortest (Florida) and the longest (Texas A&M) trip.
PAC 12
| New Mexico | University Stadium | Arizona | 435 | New Mexico | 0 | 435 | Arizona |
| Las Vegas Bowl | Sam Boyd Stadium | Utah | 434 | BYU | 390 | 44 | Utah |
| Heart of Dallas | Cotton Bowl Stadium | Washington | 2107 | Southern Miss | 487 | 1620 | Washington |
| Sun | Sun Bowl Stadium | Washington State | 1710 | Miami | 1938 | 228 | WSU |
| Foster Farms | Levi’s Stadium | UCLA | 341 | Nebraska | 1641 | 1300 | Nebraska |
| Armed Forces | Amon G. Carter Stadium | Cal | 1704 | Air Force | 715 | 989 | Cal |
| Holiday | Qualcomm Stadium | USC | 121 | Wisconsin | 2029 | 1908 | Wisconsin |
| Rose | Rose Bowl | Stanford | 354 | Iowa | 1789 | 1435 | Stanford |
| Alamo | Alamodome | Oregon | 2149 | TCU | 264 | 1885 | TCU |
| Cactus | Chase Field | Arizona State | 9 | West Virginia | 2077 | 2068 | WVU |
The Pac-12 had the second worst bowl travel schedule, in terms of differences and mileage, only to the Big Ten. They hold the most extremes in nearly every category; Oregon had the furthest distance of the Power 5, traveling over 2,100 miles to Texas, and Arizona State had the shortest distance that wasn’t on their own campus, 9 miles. Arizona State and West Virginia’s match-up in the Cactus Bowl was also the biggest difference in the Power 5, a monstrous difference of 2,068 miles. And ASU lost. Washington State and Miami had the most total mileage between 2 opponents, traveling 3,648 miles between the two of them. The Pac-12 lost 3 of their 5 biggest difference match-ups, but winning the 4th and 5th. The teams that went the furthest also did the best, winning 4 of the 5 longest games (Oregon, the longest, is the only loss).
- Worst difference: 1,885 miles. Oregon (2,149) vs. TCU (264)
- Most favorable difference: Cactus Bowl, 2,068 miles. Arizona State (9) vs. West Virginia (2,077)
- The Pac-12’s 6 winners went 6,744 miles on an average trip of 1,124 miles, while their opponents averaged only 886.5 en route to a total of 5,319 (including New Mexico, who played at their home stadium in Albuquerque).
- 3 of the 4 Pac-12 losers (USC, UCLA, ASU) were benefactors of massive travel differences but couldn’t capitalize. Overall, the Pac-12 losers traveled 2,620 miles (averaging 655) and the opponents went 6,011 miles, averaging 1,503. If you remove Oregon as the outlier, those numbers leap to a mere 471 total Pac-12 miles traveled compared to 5,747 opponent miles. Yikes.
Big 12
| Athletic | Citrus Bowl | Baylor | 1117 | North Carolina | 623 | 696 | Baylor |
| Texas | NRG Stadium | Texas Tech | 526 | LSU | 279 | 247 | LSU |
| Orange | Sun Life Stadium | Oklahoma | 1482 | Clemson | 708 | 774 | Clemson |
| Sugar | Superdome | Oklahoma State | 715 | Ole Miss | 348 | 367 | Ole Miss |
| Liberty | Liberty Bowl | Kansas State | 577 | Arkansas | 147 | 430 | Arkansas |
| Alamo | Alamodome | TCU | 264 | Oregon | 2149 | 1885 | TCU |
| Cactus | Chase Field | West Virginia | 2077 | Arizona State | 9 | 2068 | WVU |
The Big 12 had to go further than all but one of their opponents; TCU had a shorter trip than Oregon as we saw in the previous conference. That said, the Pac-12 did do very well in the longer games; Baylor beating UNC when UNC had half the trip, and WVU beating ASU in that pseudo-home game. However, Oklahoma, who had the 2nd longest trip of the Big 12, was defeated soundly by a Clemson team who had about half as long of a trip.
- Worst difference: 2,068 miles, WVU (2,077) vs. ASU (9)
- Most favorable difference: 1,885 miles, TCU (264) vs. Oregon (2,149)
- The 3 Big 12 winners traveled 3458 miles, averaging a hefty 1,152 per trip compared to their opponents 2,781 total miles and 927 average.
- The 4 Big 12 losers also traveled more than their opponents, accruing 3,300 miles and averaging 825, while their opponents only ventured 1,482 miles, averaging 370.5 miles.
ACC
| Sun | Sun Bowl Stadium | Miami Hurricanes | 1938 | WSU Cougars | 1710 | 228 | WSU |
| Pinstripe | Yankee Stadium | Duke Blue Devils | 503 | Indiana Hoosiers | 768 | 265 | Duke |
| Independence | Independence Stadium | Virginia Tech Hokies | 942 | Tulsa Golden Hurricanes | 336 | 606 | VT |
| Military | Navy/USMC Stadium | Pittsburgh Panthers | 266 | Navy | 0 | 266 | Navy |
| Athletic | Citrus Bowl | UNC Tar Heels | 623 | Baylor Bears | 1117 | 696 | Baylor |
| Belk | Bank of America Stadium | NC State Wolfpack | 165 | MSU Bulldogs | 531 | 366 | Miss. St. |
| Peach | Georgia Dome | FSU Seminoles | 263 | Houston Cougars | 795 | 532 | Houston |
| Orange | Sun Life Stadium | Clemson Tigers | 708 | Oklahoma Sooners | 1482 | 774 | Clemson |
The ACC had a relatively favorable travel schedule, but they only managed to go 3-5 (one of the teams is in the CFP Final, however). The ACC’s 8 teams only traveled 5,408 miles while their opponents amassed 6,739 miles. The Sun Bowl, the very first bowl game in which an ACC team appeared this year, was the only game outside of the Eastern Time Zone. The team that went the most miles (Miami) lost, as did the team that traveled the 4th-most (UNC). Virginia Tech, Clemson, and Duke rounded out the top 5 in terms of mileage, all winning their games. The ACC was also favored in 4 of their 5 biggest differences (Independence Bowl was the only disadvantage), though Clemson was the team in that category that won.
- Worst difference: 606 miles; Virginia Tech (942) vs. Tulsa (336)
- Most favorable difference: 774 miles, Clemson (708) vs. Oklahoma (1,482)
- The 3 ACC winners, Duke, Tech, and Clemson, averaged 718 miles per game, totaling 2,153.
- The 5 ACC losers traveled less than their opponents, going 3,255 (651 average miles) versus 4,153 (831 average) miles.
A few more tidbits:
- Big Ten: 13,725 miles traveled, 5-5 record.
- SEC: 3,904 miles, 8-2.
- Pac-12: 9,364 miles, 6-4.
- Big 12: 6,758 miles, 3-4.
- ACC: 5,408 miles, 3-5.
- Teams that traveled further than their opponents went 12-13 (5-5 Big Ten, 1-1 SEC, 3-1 Pac-12, 2-4 Big 12, 1-2 ACC)
- Teams that traveled a shorter distance than their opponents went 12-6 (0-0 Big Ten, 7-1 SEC, 2-2 Pac-12, 1-0 Big 12, 2-3 ACC).
- Power 5 teams traveled a combined 39,159 miles this bowl season (excluding Clemson’s and Alabama’s trip to the Championship).
Thanks for slogging through the numbers.
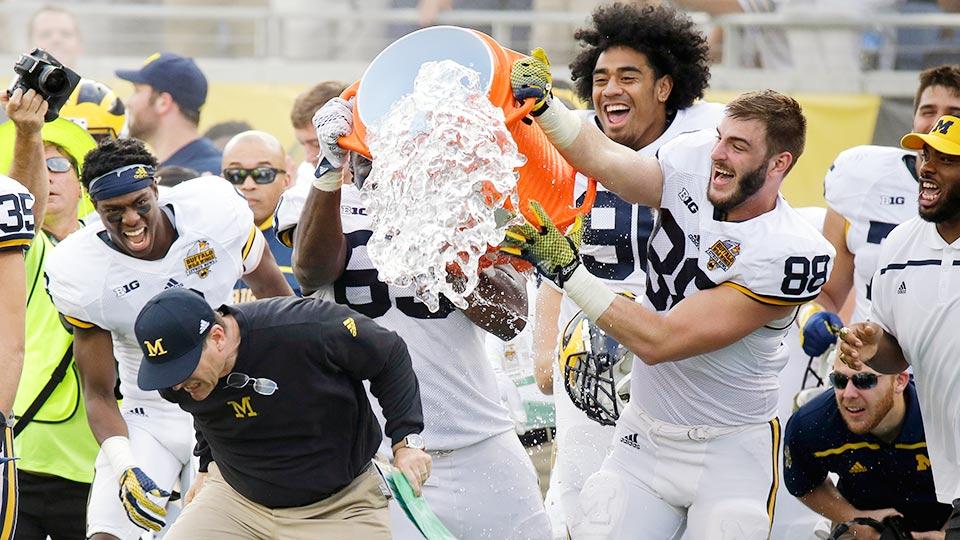
Photo Credit: John Raoux/AP

- College World Series Bound - Jun 14, 2019
- 2019 Michigan Baseball Season Update: Heat Check - May 9, 2019
- Michigan Baseball 2019: Over Halfway There - Apr 19, 2019